
Introduction
BPAS is the UK's leading abortion care charity, providing safe, confidential, high-quality abortion treatment for more than 55 years. We also provide contraception, STI testing and vasectomy services, and 98% of the women we see have their abortion treatment paid for by the NHS (or other government departments). This report fulfils our obligation to the NHS bodies that commission our services under NHS Standard Contracts.
As a healthcare provider bound by the NHS standard contract, BPAS are required to report annually on key equality metrics as part of the Workforce Race Equality Standard (WRES) and the Workforce Disability Equality Standard (WDES). This report and accompanying action plan fulfil our obligations in this regard.
BPAS is committed to a policy of equal opportunity and welcomes applicants from all sections of the community as we recognise the value that a diverse workforce brings.
Work following the previous year’s reporting, has seen changes and additions to some questions in the annual employee survey to help reporting, with the aim to therefore help direct positive change.
BPAS will continue to encourage data capture and reporting through the recruitment process and utilising the full offering of the HR self-service system.
BPAS will issue the annual employee survey in 2024 using an external provider to try and encourage more honest feedback and participation and hope to gain more insight into equality issues.
Data drawn from BPAS’ HR system, recruitment monitoring systems and annual employee survey were used to populate the 2024 WRES and WDES reports. Several of the required metrics could not be meaningfully reported upon due to the small number of BME (Black and Minority Ethnic) or disabled employees within the current workforce.
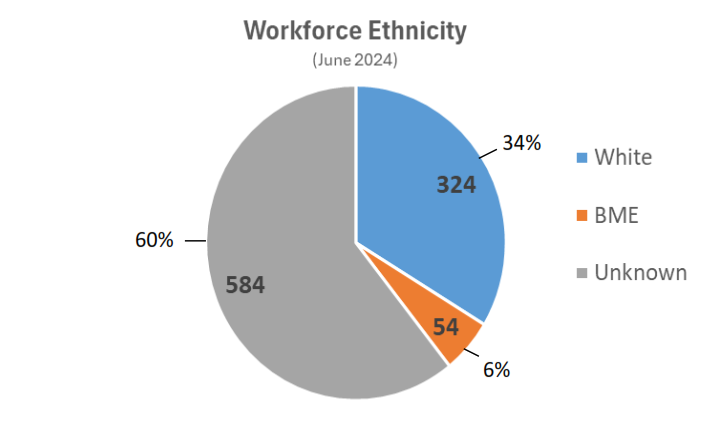
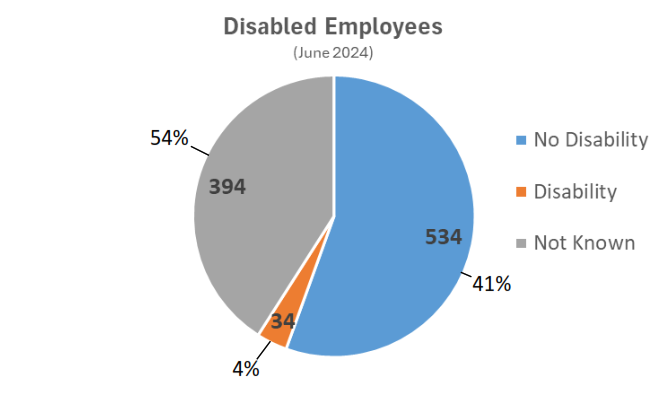
As of June 2024, the proportion of BME employees within the workforce was 6%, down from 7% in June 2023. The ethnicity of a high proportion of employees was still unknown (60%). In terms of Disability, 4% of the workforce were recorded as having a disability (up from 3% in June 2023), with 54% of the workforce undeclared or unknown. Representation of disabled members at executive and board level is lower than that found in the overall workforce, with no individuals working at that level declaring a disability.
There appears to be some inequality in the recruitment shortlisting of BME candidates.
The accompanying action plan highlights key actions that BPAS will undertake in response to these findings.
Workforce Race Equality Standard (WRES) Metrics
Workforce Ethnic Groupings (Indicators 1 & 8)
| Category of staff | % declared as White | % declared as BME | % undeclared or unknown |
| Clinical Staff | 28% | 5% | 67% |
|
Non-Clinical Staff
|
39% | 6% | 55% |
|
Executive
|
55% | 0% | 45% |
| Total | 34% | 6% | 60% |
Recruitment (Indicator 2)
| Recruitment status | No in group | % declared as White | % declared as BME | % undeclared or unknown |
| Applications Submitted | 6000 | 63% | 34% | 3% |
| Shortlisted | 1590 | 75% | 22% | 3% |
| Interviewed | 981 | 77% | 20% | 3% |
Disciplinary Action (Indicator 3)
| Relative likelihood of BME staff entering the formal disciplinary process compared to white staff | 0* |
*A figure below one would indicate that BME staff members are less likely than white staff to enter the formal disciplinary process. This data is reported with caution due to the low number of employees involved in disciplinary proceedings.
Non- Mandatory Training and CPD (Indicator 4)
BPAS will not report on this indicator because our learning and development recording practices do not allow an assessment of any disparate access to non-mandatory training and CPD by ethnic grouping.
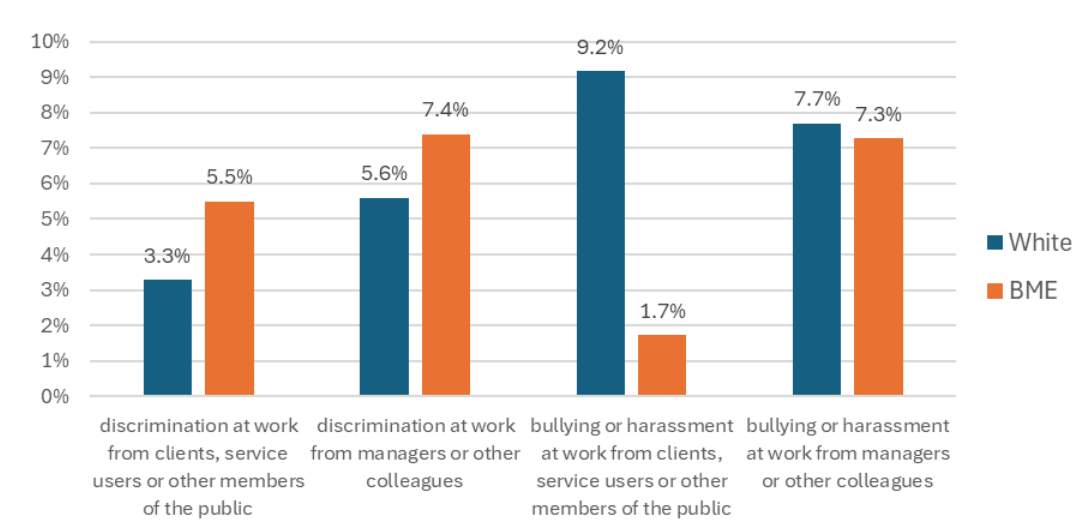
Indicators 5 - 7
Care should be taken when interpreting these results due to the small self- reported BME respondent size (n = 37). We have taken the decision to publish these findings in the interest of transparency and as a reflection of our commitment to improving workplace equality.
This data has been collated from the 2023 Employee Survey, in which the following questions were asked:
• discrimination at work from clients, service users or other members of the public?
• discrimination at work from managers or other colleagues?
• bullying or harassment at work from clients, service users or other members of the
public?
• bullying or harassment at work from managers or other colleagues?
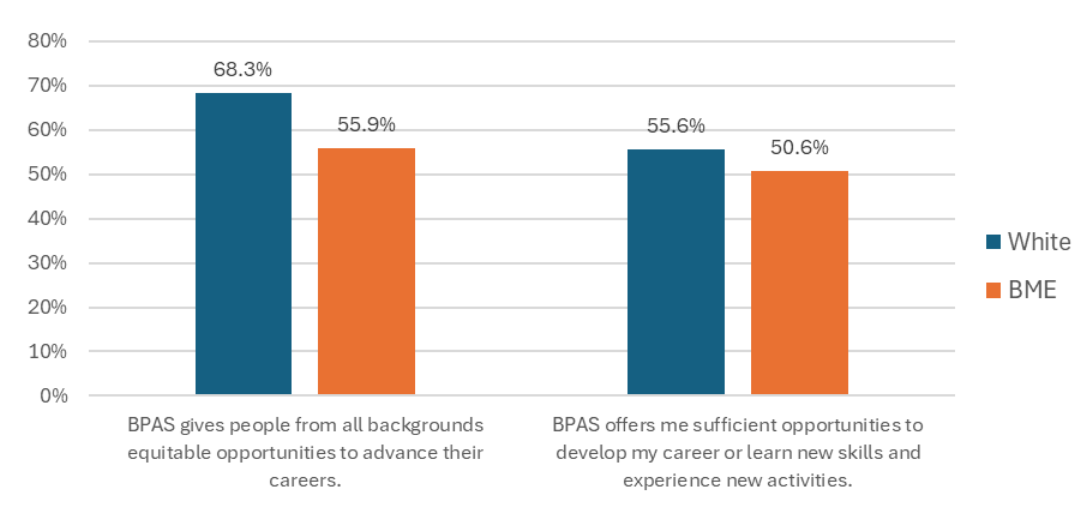
The following data is taken as the percentage positive response (‘Strongly agree’ and ‘Agree’) from the 2023 Employee Survey to the following statements:
• BPAS gives people from all backgrounds equitable opportunities to advance their careers
• BPAS offers me sufficient opportunities to develop my career or learn new skills and experience new activities
Workforce Disability Equality Standard (WDES) Metrics
Workforce Disability Metrics (1 & 10)
| No Disability | Disability | Not Known | |
| Clinical Staff | 52% | 3% | 45% |
|
Non-Clinical Staff
|
59% | 4% | 37% |
|
Executive
|
82% | 0% | 18% |
| Total | 54% | 4% | 42% |
Formal Capability Process (Metric 2)
BPAS will not report on this indicator as no formal capability processes were conducted this year.
Metrics 3 – 8
Care should be taken when interpreting these results due to the small self- reported disabled respondent size. We have taken steps to encourage self-reporting, including regular internal communications prompting employees to regularly update their information.
d
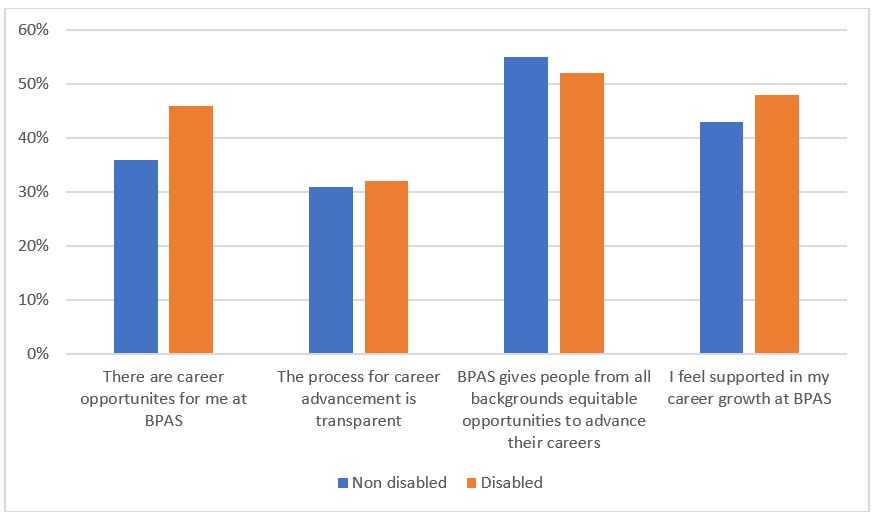
The following data is taken as the percentage positive response (‘Strongly agree’ and ‘Agree’) from the 2023 Employee Survey to the following statements:
• BPAS gives people from all backgrounds equitable opportunities to advance their careers
• BPAS offers me sufficient opportunities to develop my career or learn new skills and experience new activities
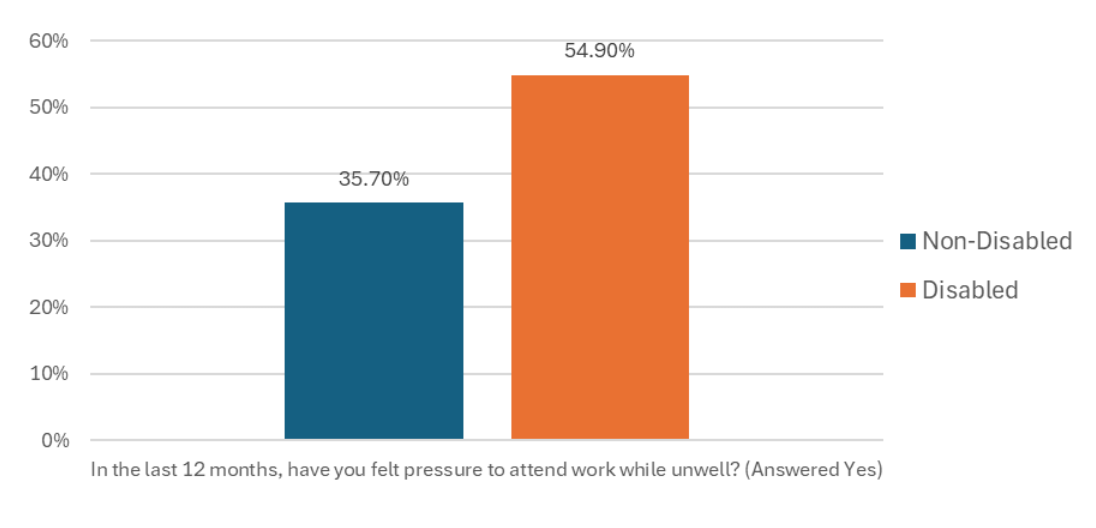
This data has been collated from the 2023 Employee Survey, in which the following question was asked:
• In the last 12 months, have you felt pressure to attend work while unwell?
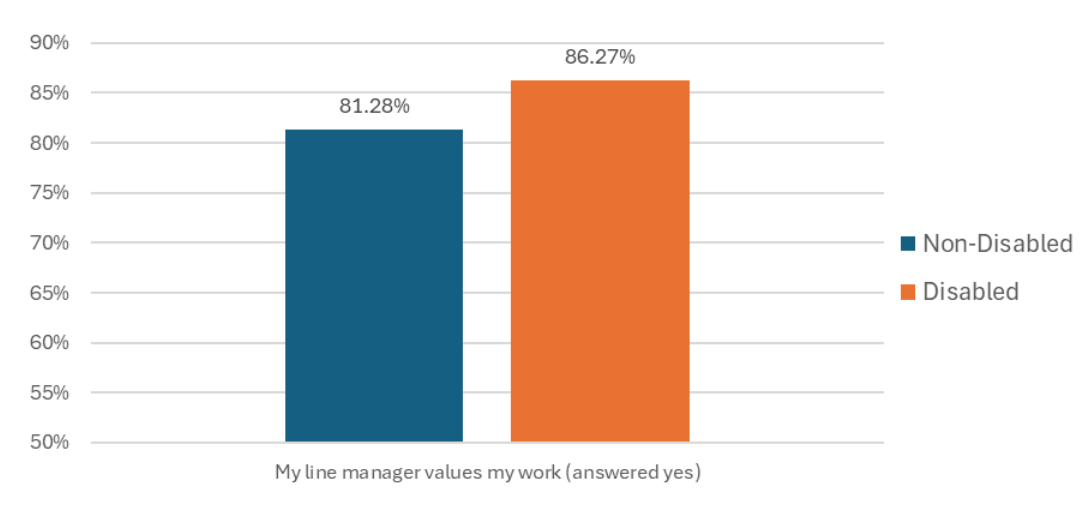
The following data is taken as the percentage positive response (‘Strongly agree’ and ‘Agree’) from the 2023 Employee Survey to the question:
• My line manager values my work
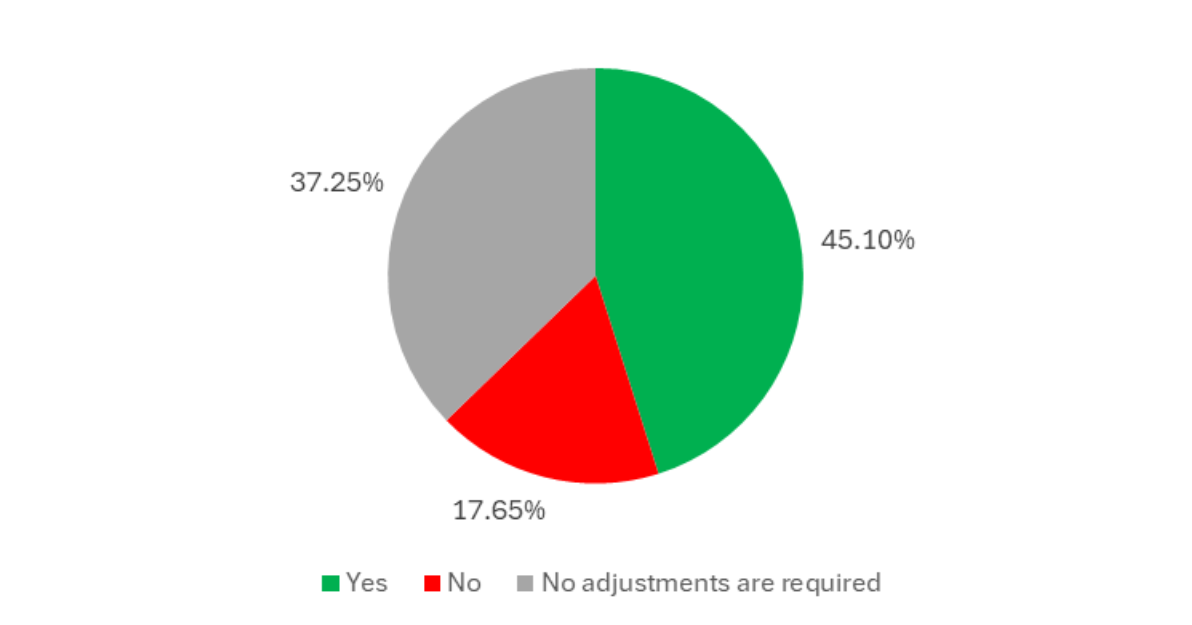
The following data is taken as the percentage responses from the 2023 Employee Survey to the question, asked to disabled staff only:
• Has BPAS made the appropriate reasonable adjustments?
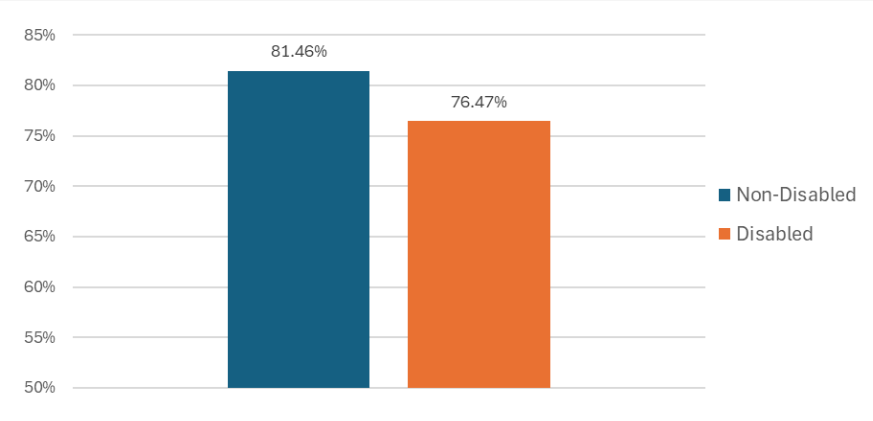
The Engagement score has been calculated as the overall average positive response (‘Strongly agree’ and ‘Agree’) of the following 2023 Employee Survey statements:
• I am happy with my current job
• I plan to be at BPAS in 12 months’ time
We encourage open discussion between colleagues, management and peers through informal conversation or through the people forum where specifics points can be put forward for review.
This WRES/WDES report has been ratified by a representative of the Finance, Audit and Risk Committee, agreement to be noted in BPAS board members committee minutes and WRES/WDES uploaded to BPAS website.